Central Metrics Monitoring
SeaweedFS Enterprise collects Prometheus metrics from every master, volume server, filer, and S3 node into the admin server and renders them as live dashboards in the Admin UI — no JavaScript chart library, no external Grafana dependency, no additional infrastructure to operate. Worker task-queue and slot metrics are gathered locally inside the admin server itself.
How it works
-
Each node starts a dedicated metrics listener with
-metricsPort. The listener is off by default (0), so enabling monitoring is opt-in per node and never exposes telemetry on client-facing service ports. -
Nodes advertise their metrics port through cluster registration and heartbeat. The admin server discovers every node’s metrics endpoint from the master’s topology — no manual scrape configuration needed.
-
The admin server scrapes concurrently every 15 seconds, parses the Prometheus text exposition, and derives counter rates and histogram quantiles (p50, p95, p99) in bounded in-memory series.
-
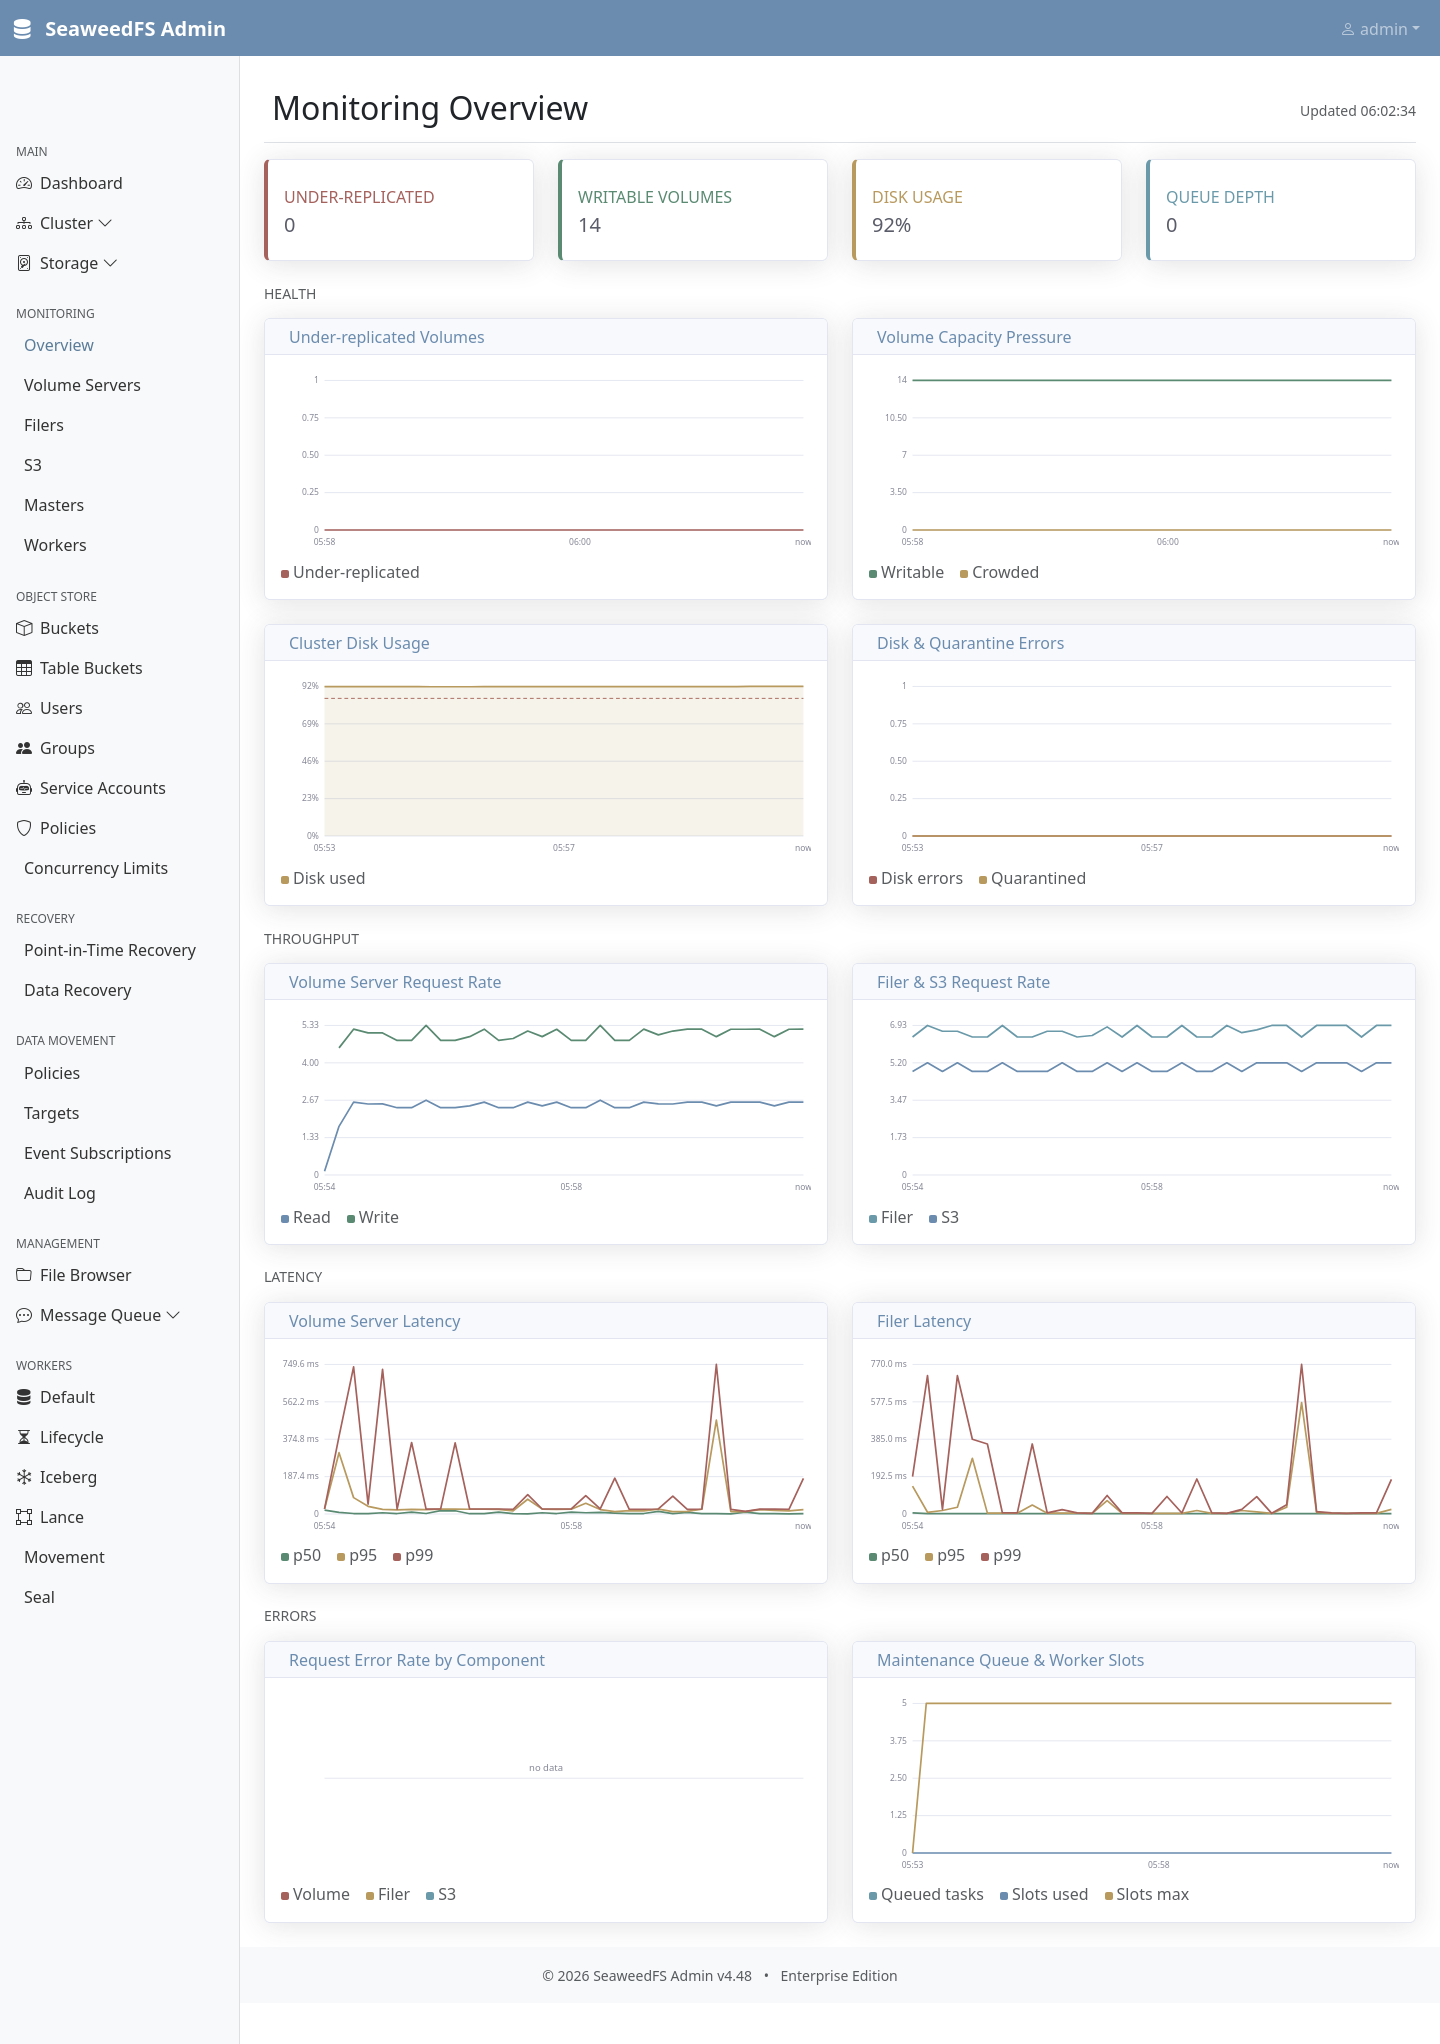
Six monitoring pages render server-side inline SVG charts with shared timestamp axes, multi-series legends, unit-aware formatting (µs, ms, bytes, %), and threshold lines.
Monitoring pages
Overview (/monitoring)
Cluster-wide health and performance at a glance:
- Health: under-replicated volumes, writable/crowded volumes, cluster disk usage
- Throughput: volume server read/write rates; filer and S3 request rates
- Latency: p50/p95/p99 for volume and filer operations
- Errors: request errors, disk/IO errors, quarantined volumes
- Maintenance: queue depth and worker slot utilization
Volume Servers (/monitoring/volume-servers)
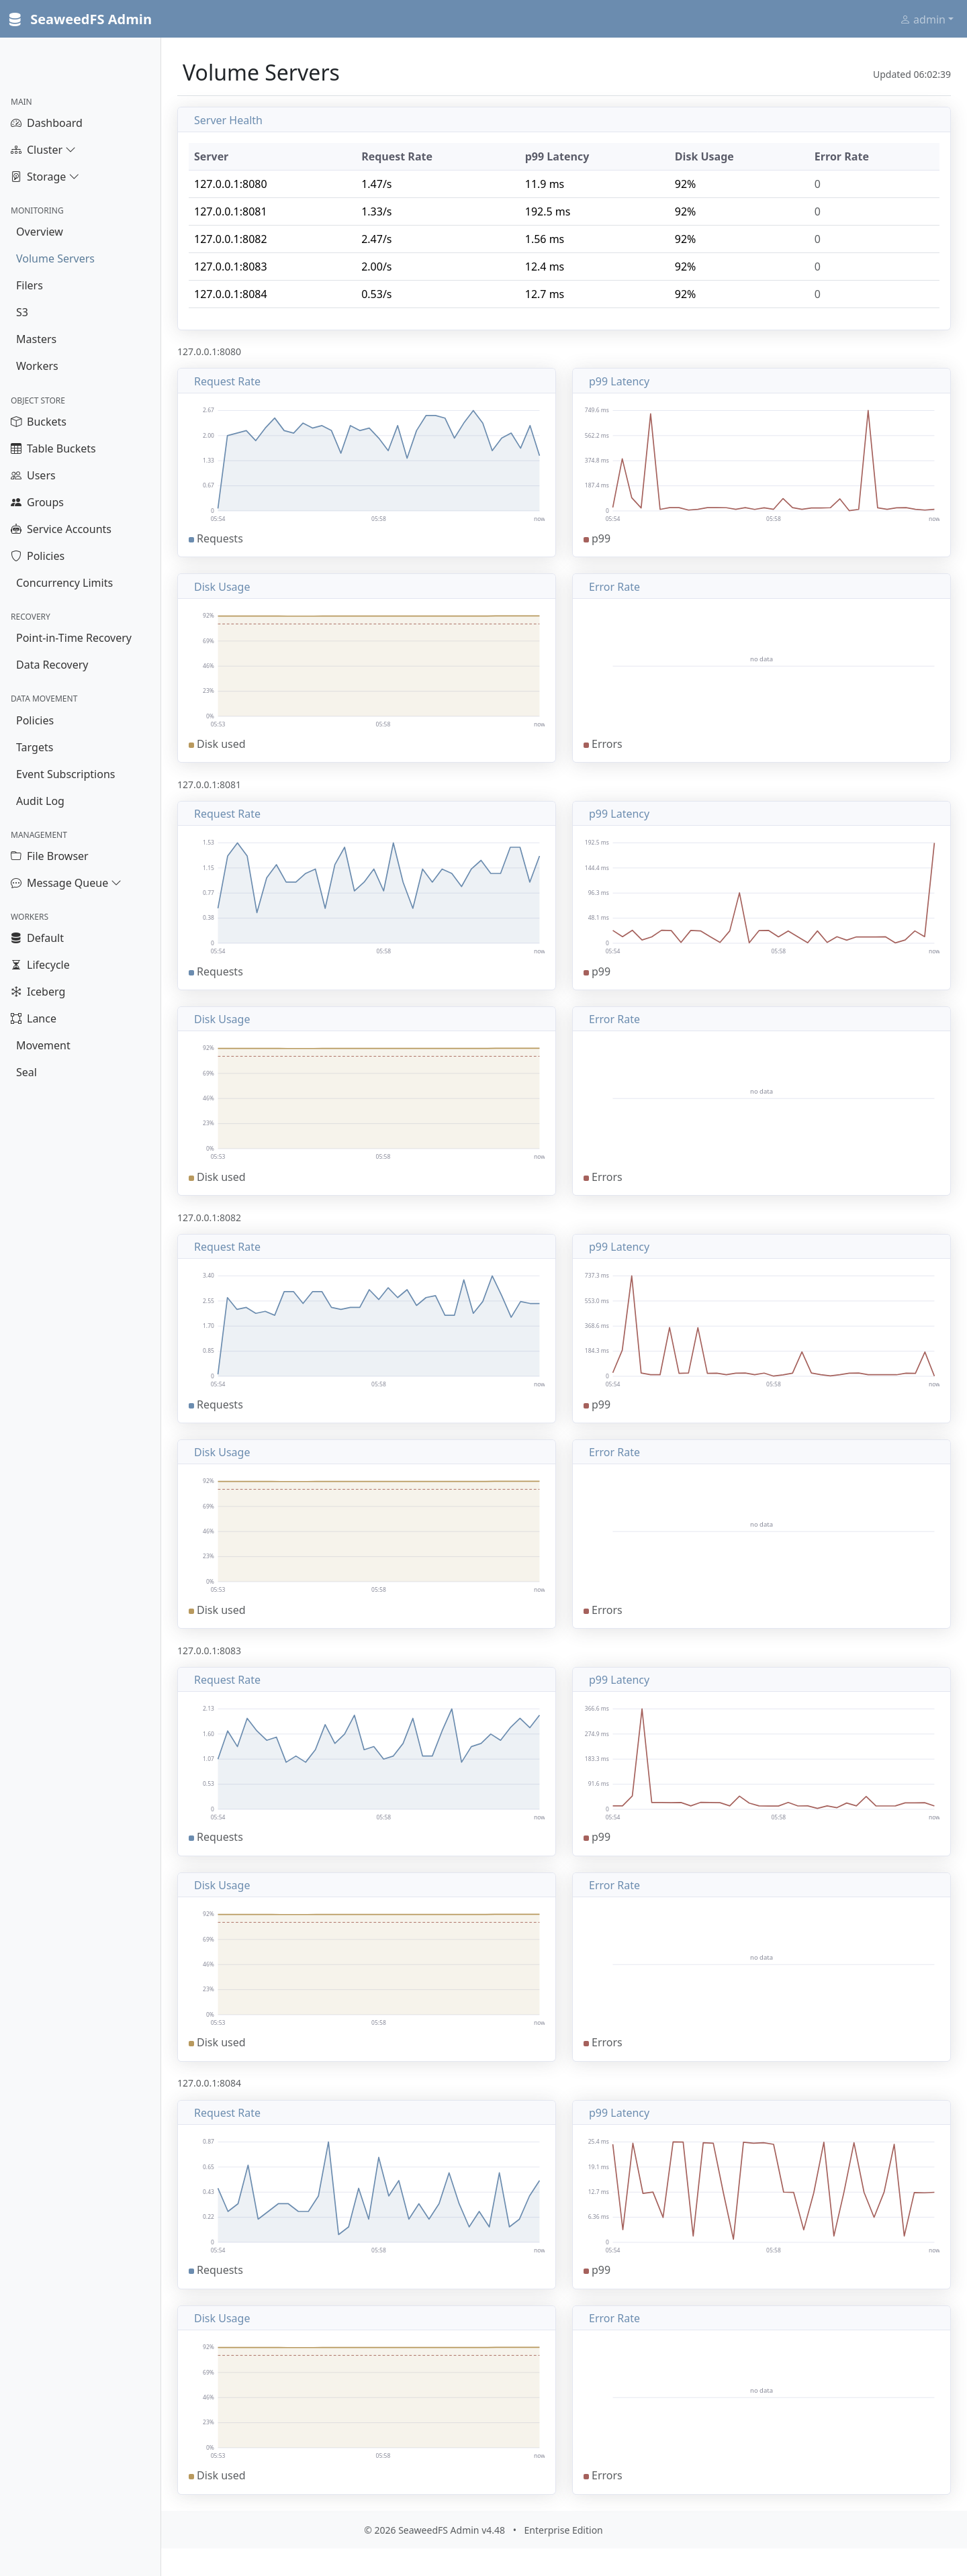
Per-server detail with a health table:
- Request rate (reads vs. writes, classified by HTTP method)
- p99 latency
- Disk usage percentage (joined by timestamp)
- Error rate
Filers (/monitoring/filers)
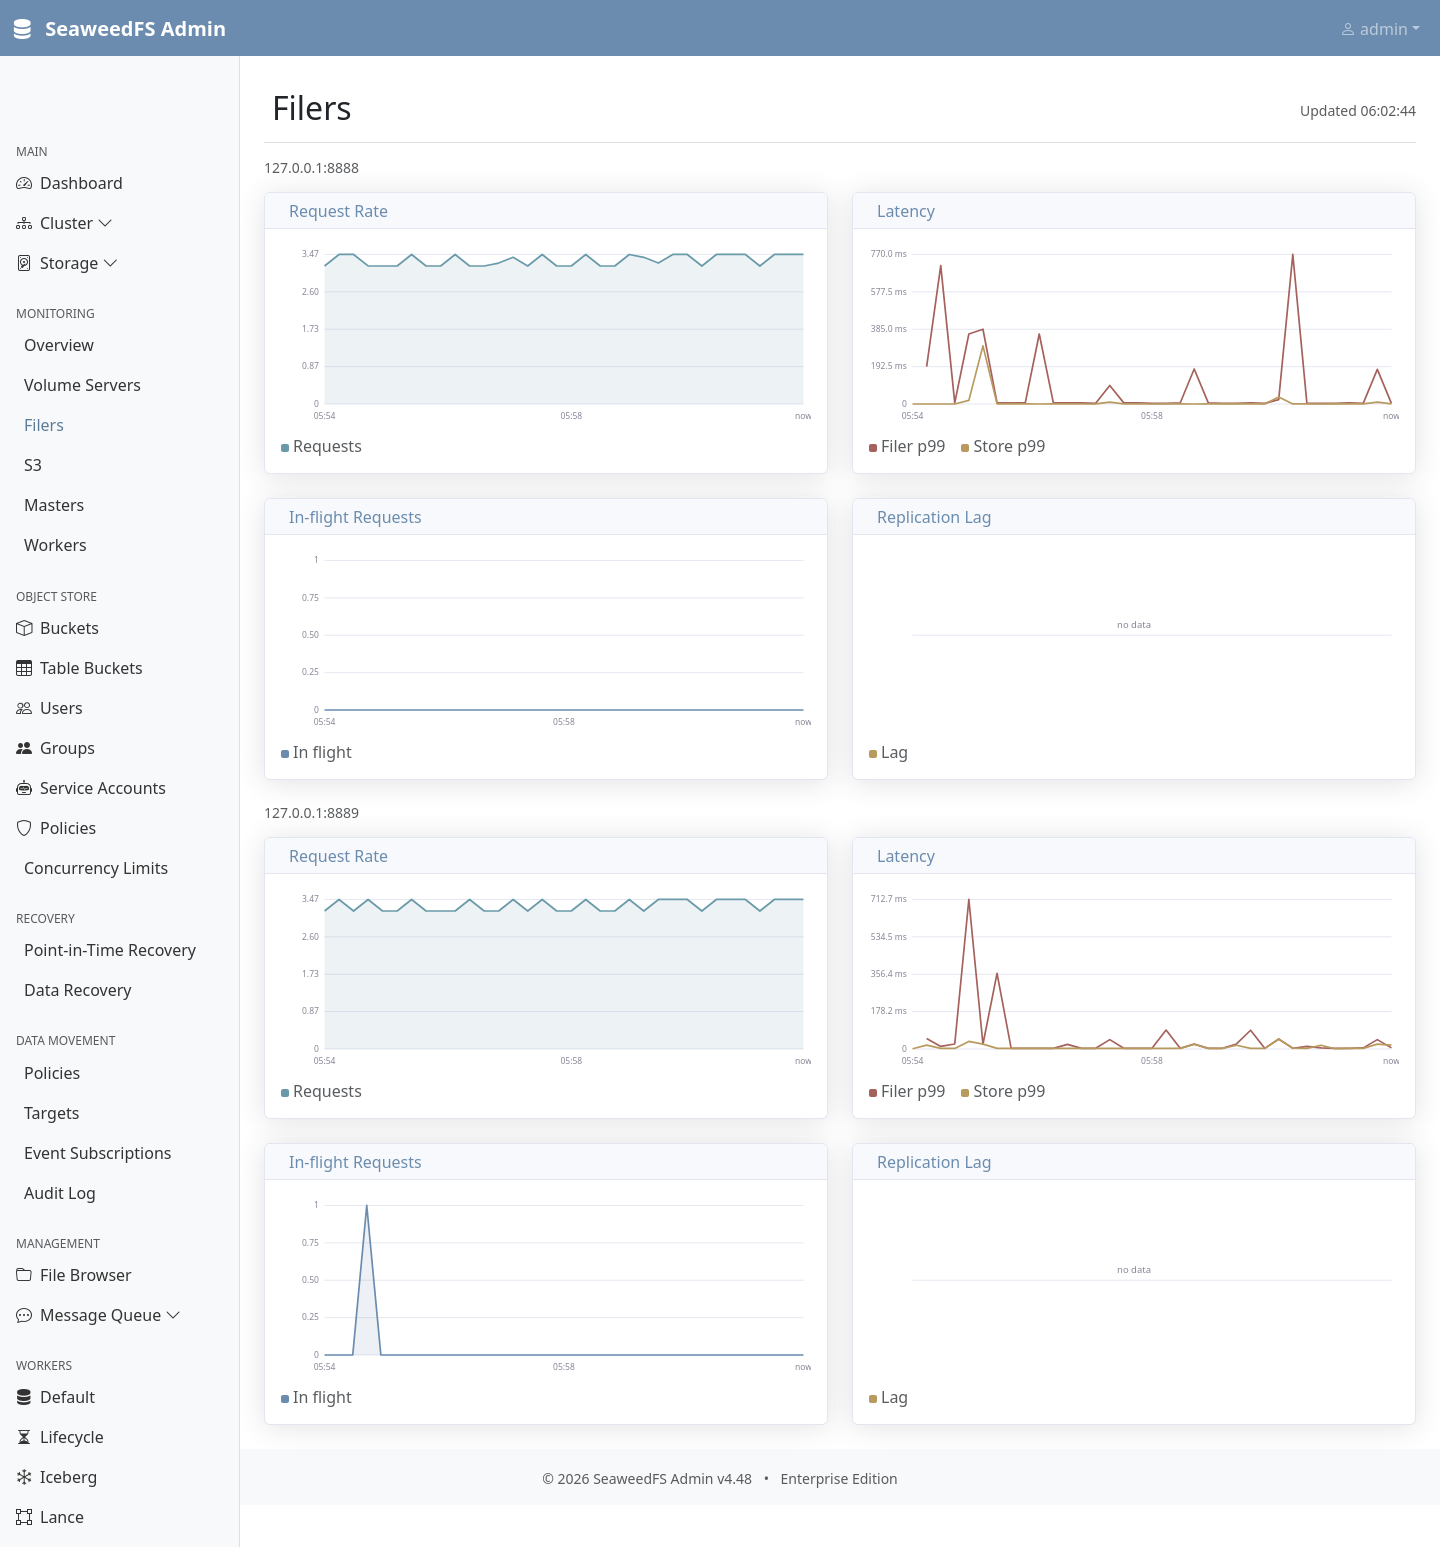
- Request rate
- Store latency
- In-flight requests
- Replication lag
S3 (/monitoring/s3)
- Operation rate
- 4xx/5xx error rate
- p99 latency
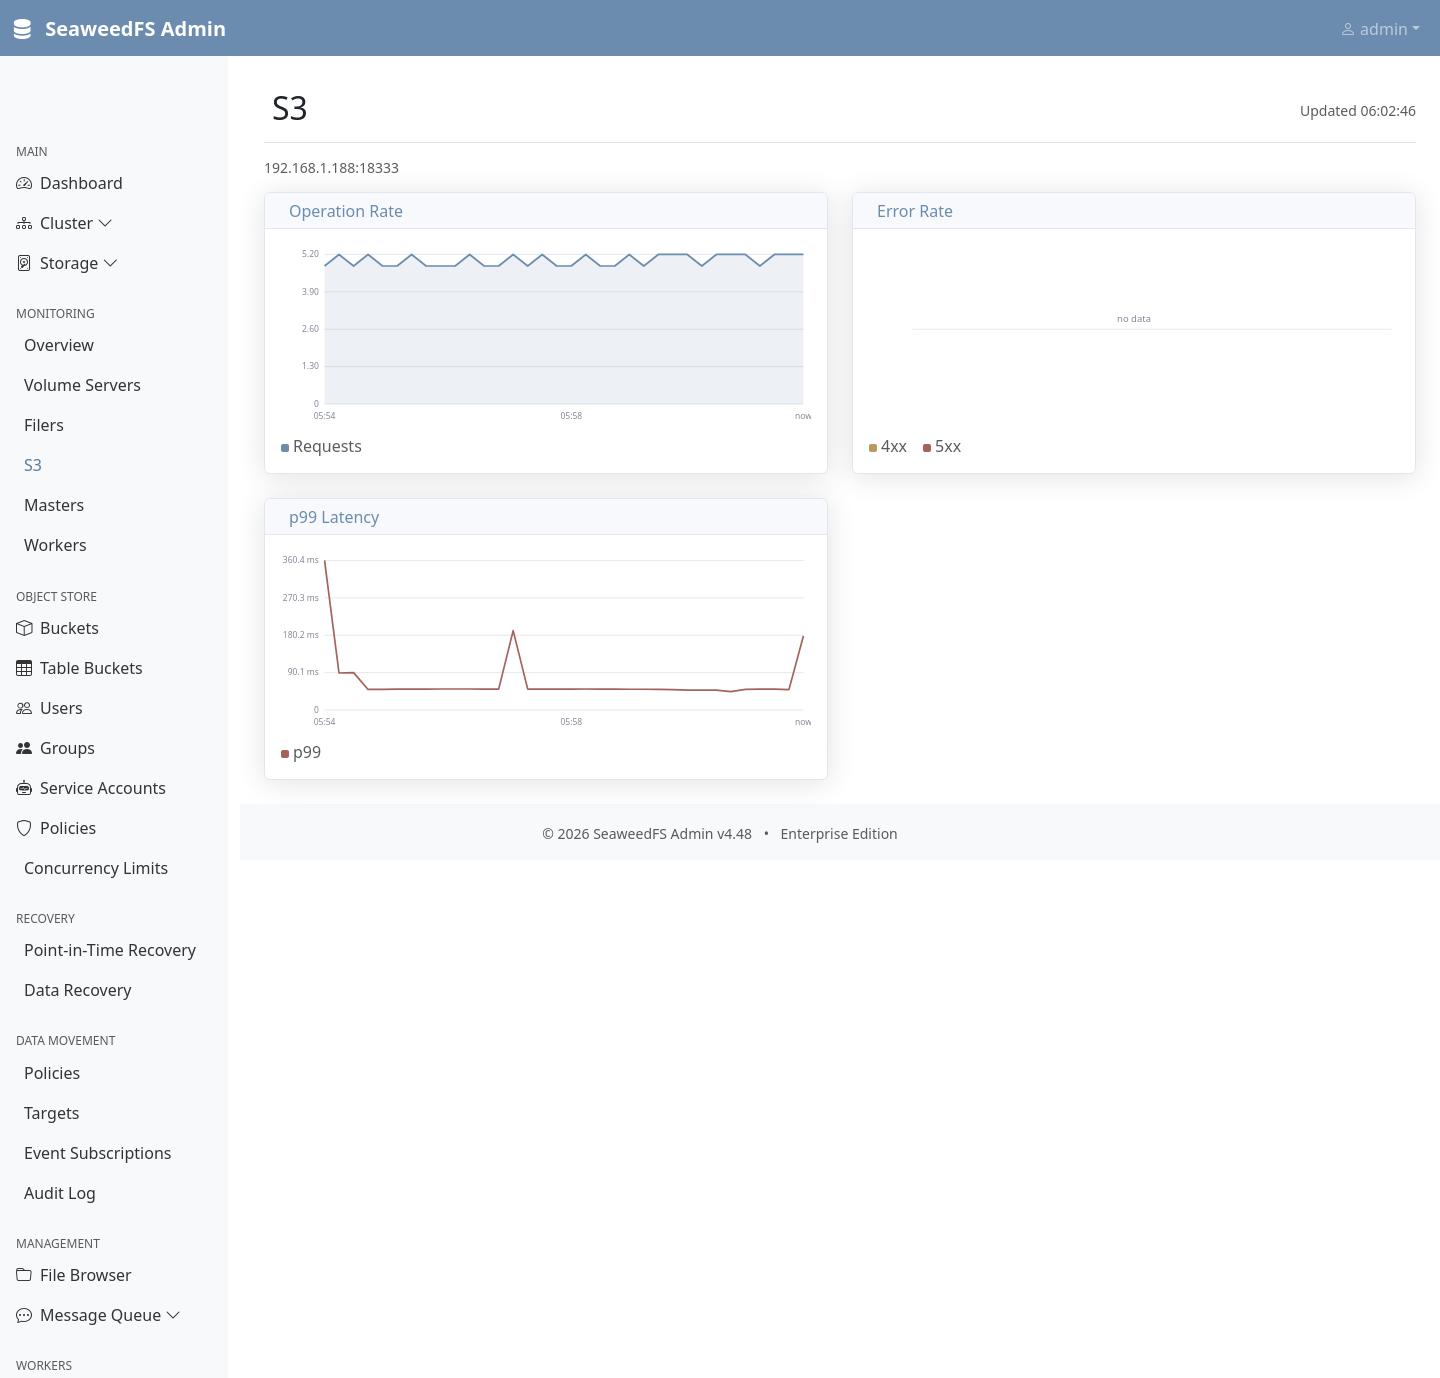
S3 metrics are collected via the dedicated metrics listener, never the tenant-facing S3 port, so bucket labels in the metrics never bypass S3 authorization.
Masters (/monitoring/masters)
- Heartbeat rate
- Volume creation rate
- Leader changes
- Replica placement mismatches
Cluster-wide master gauges (under-replicated, writable, crowded) are read only from the current leader, so stale values from former leaders are never summed in.
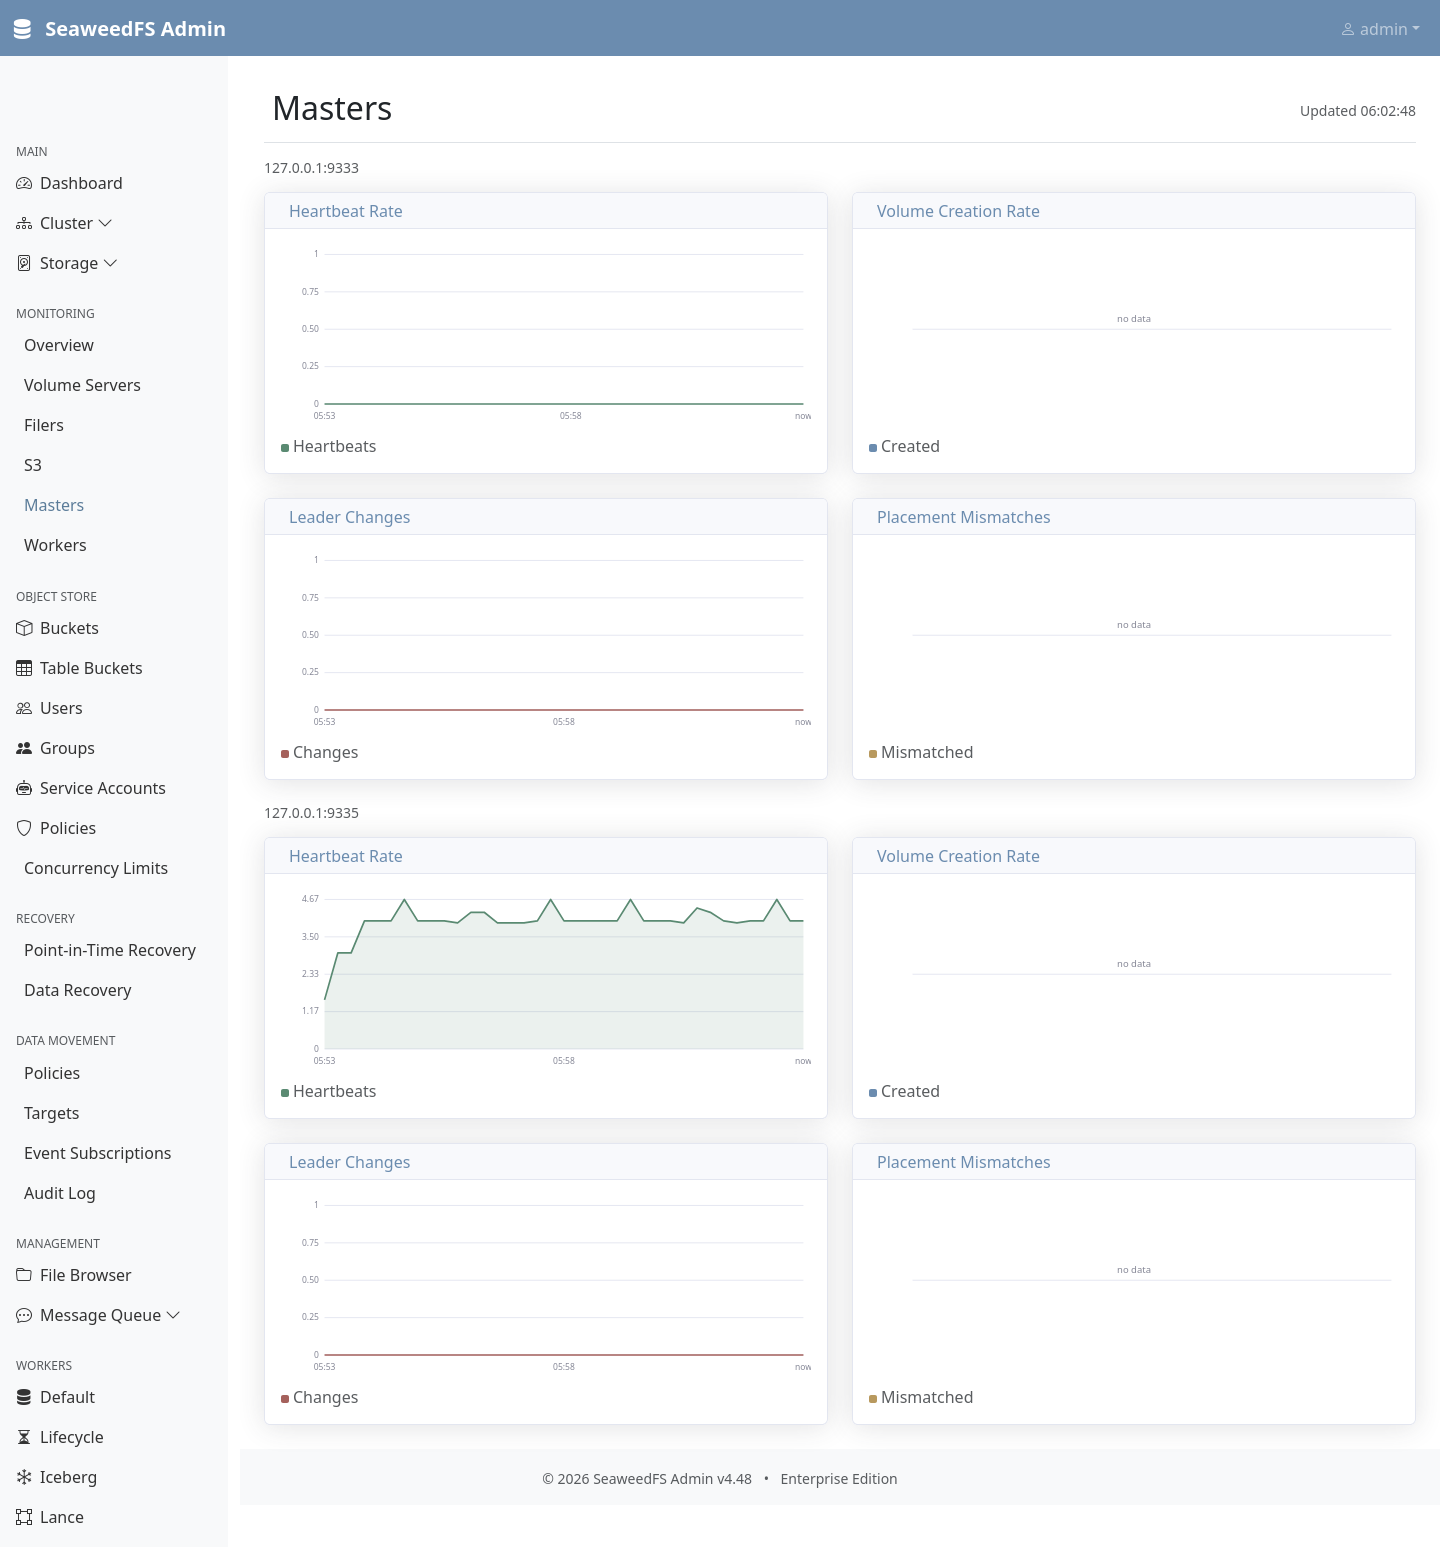
Only masters that emit master metrics appear here — in a healthy cluster that is the leader, since followers receive no heartbeats and create no volumes.
Workers (/monitoring/workers)
- Task queue depth
- Worker slot utilization
- Task completion rate
- Connected worker table
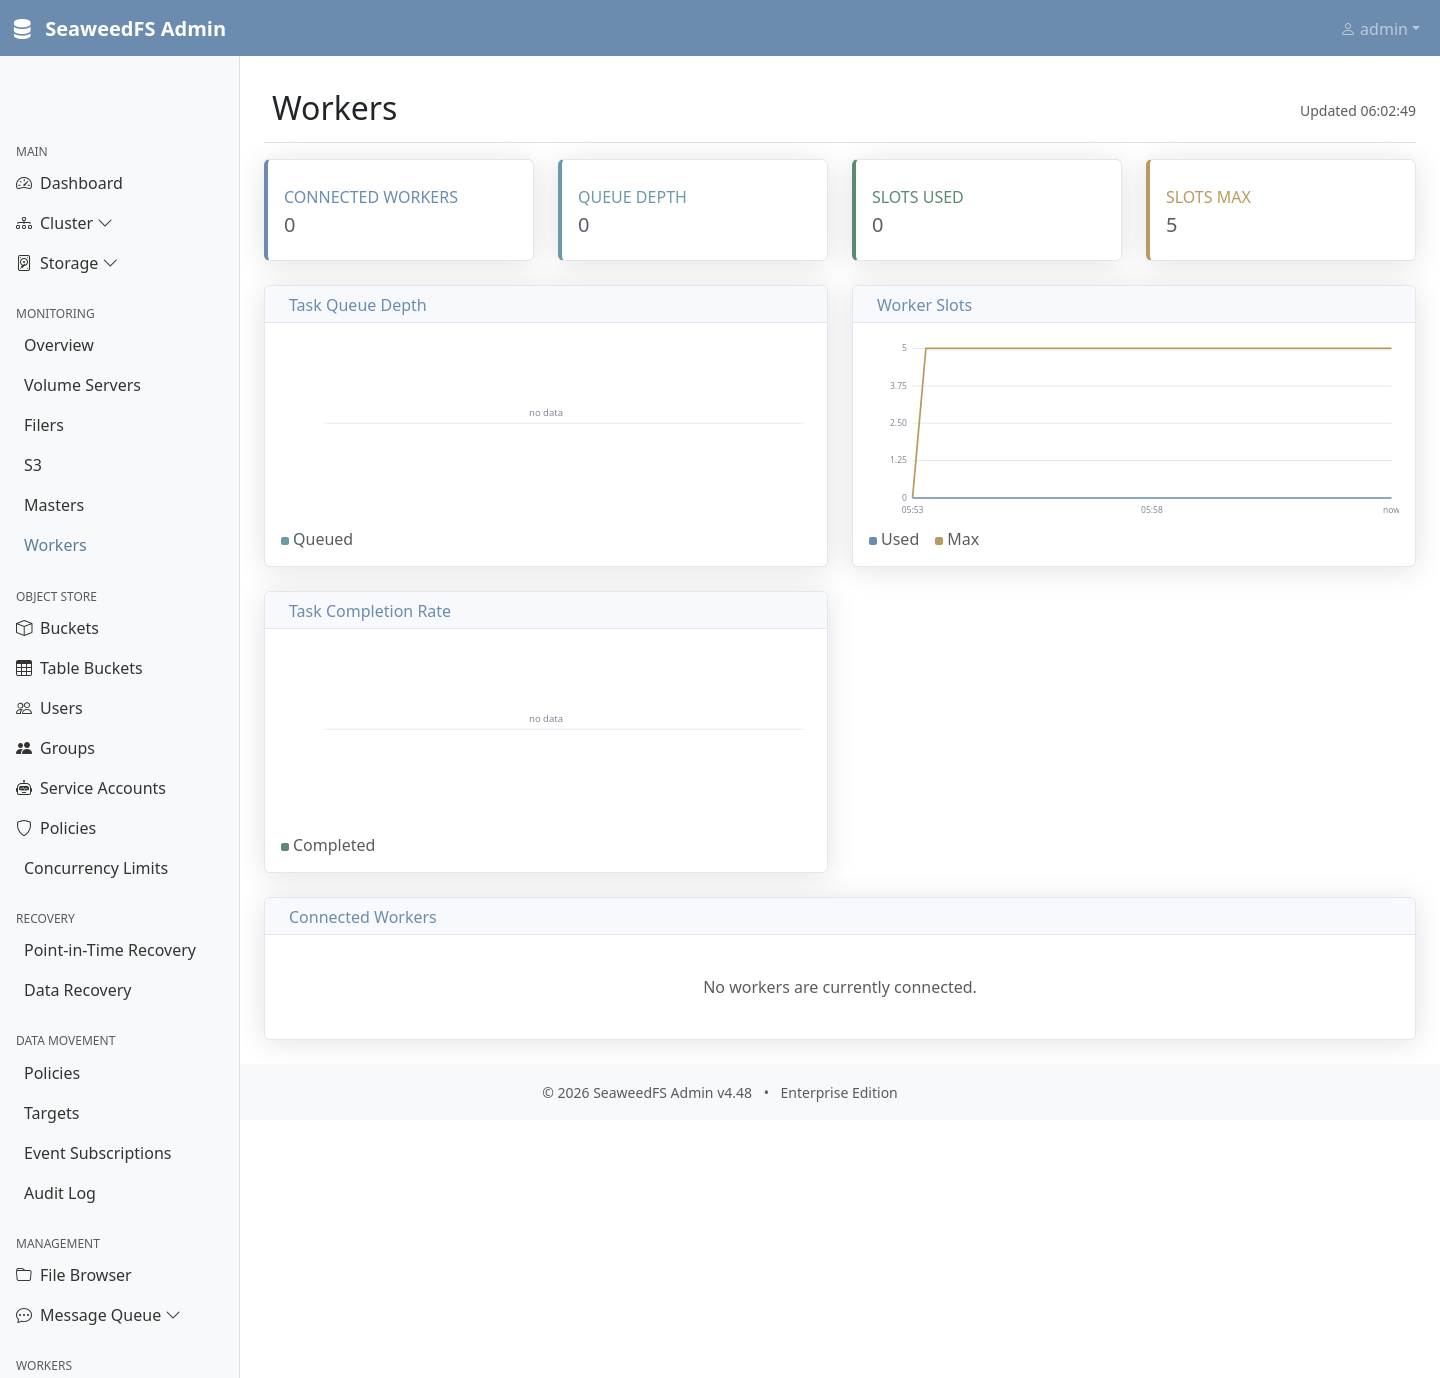
The connected-workers table lists embedded maintenance workers (as run by weed mini). External plugin workers started with weed worker are monitored under Workers → Default (/plugin/monitoring), while their slot usage still feeds the charts above.
Enabling metrics
Start each node with -metricsPort set to a non-zero port:
weed master -metricsPort=9327 ...
weed volume -metricsPort=9328 ...
weed filer -metricsPort=9332 ...
weed admin -metricsPort=9334 ...
In weed mini or combined weed server mode, one metrics listener serves the whole shared registry; every component advertises the same port and the admin deduplicates by endpoint.
When no nodes advertise a metrics port, the monitoring pages show a clear notice explaining that -metricsPort must be enabled.
Retention and reading the charts
- Each chart keeps the most recent 240 samples; at the 15-second scrape interval that is a one-hour window per series.
- Rate and latency charts reflect the last scrape interval, not process-lifetime averages: counters are converted to per-second deltas, and histograms are converted to per-interval p50/p95/p99 quantiles.
- A brand-new scrape target needs two samples before its rate and latency charts draw — until then they read “collecting data”, distinct from “no data” (endpoint absent or metric never emitted).
- Masters page entries appear only for masters emitting master metrics — typically just the current leader.
Security
- Metrics are served on a dedicated listener, never on client-facing service ports (master, volume, filer, S3).
- S3 metrics include bucket labels and would bypass IAM authorization if exposed on the S3 port — the dedicated listener avoids this entirely.
- The admin validates advertised metrics ports are in the valid range (1–65535).
- Stale series from disappeared label sets (e.g. deleted S3 buckets) are evicted after the chart retention horizon to bound memory.